


During the recent World Cup soccer matches in Seattle Sound Transit touted a jump in light rail ridership. That increase, though temporary, was a bit of good news. However, major sporting events that draw hundreds of thousands of visitors to downtown Seattle are rare. The more important test of the regional transit system is whether it regularly increases ridership and provides a positive return on the region’s massive investment.
Ridership can be measured in several ways. The most commonly reported measure is total boardings, which counts a passenger each time they board a bus or a rail car. As measured by total boardings, transit ridership in the Puget Sound region was 10.5% lower in 2025 than it was in 2015 (see table below). That decrease in ridership was despite transit funding which grew from about $2.6 billion in 2015 to over $4.7 billion in 2024.
Of the five Puget Sound area transit agencies only Sound Transit showed an increase in ridership, but most of that came from former Metro and Community Transit customers whose bus routes were eliminated or truncated to feed rail stations. As can be seen in the table, Metro lost nearly twice as many riders as Sound Transit gained. This suggests that building the light rail extensions in the revised ST3 plan is unlikely to increase total transit ridership very much. The net increase attributable to light rail, if there is any, will likely be very small.
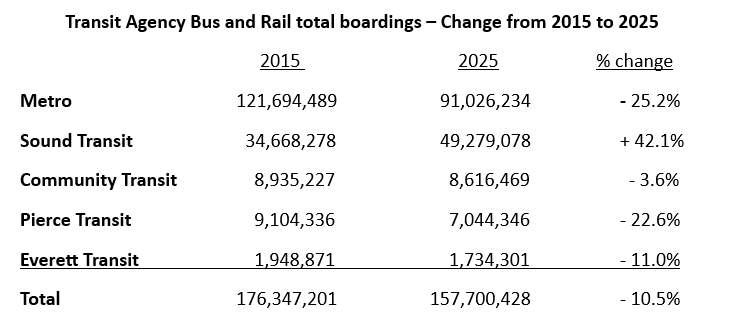
Using total boardings as a measure of transit performance has the advantage of simplicity, but when the regional system is undergoing major change it can distort the comparison. For example, truncating many of the longer Metro and Community Transit routes now forces bus riders to transfer. A trip that used to be one boarding is now counted as two, the first on the local bus and the second on light rail or on another bus route. This inflates the number of total boardings even though the number of customers may not have increased.
A better measure of transit’s impact is passenger-miles, which captures the distance passengers travel on transit as well as reflecting passenger volume. This metric avoids double-counting riders who transfer between routes. All major transit agencies report estimated annual passenger-miles to the National Transit Database.
The graph below compares annual passenger-miles in 2015 and 2024 for the Puget Sound region transit agencies.
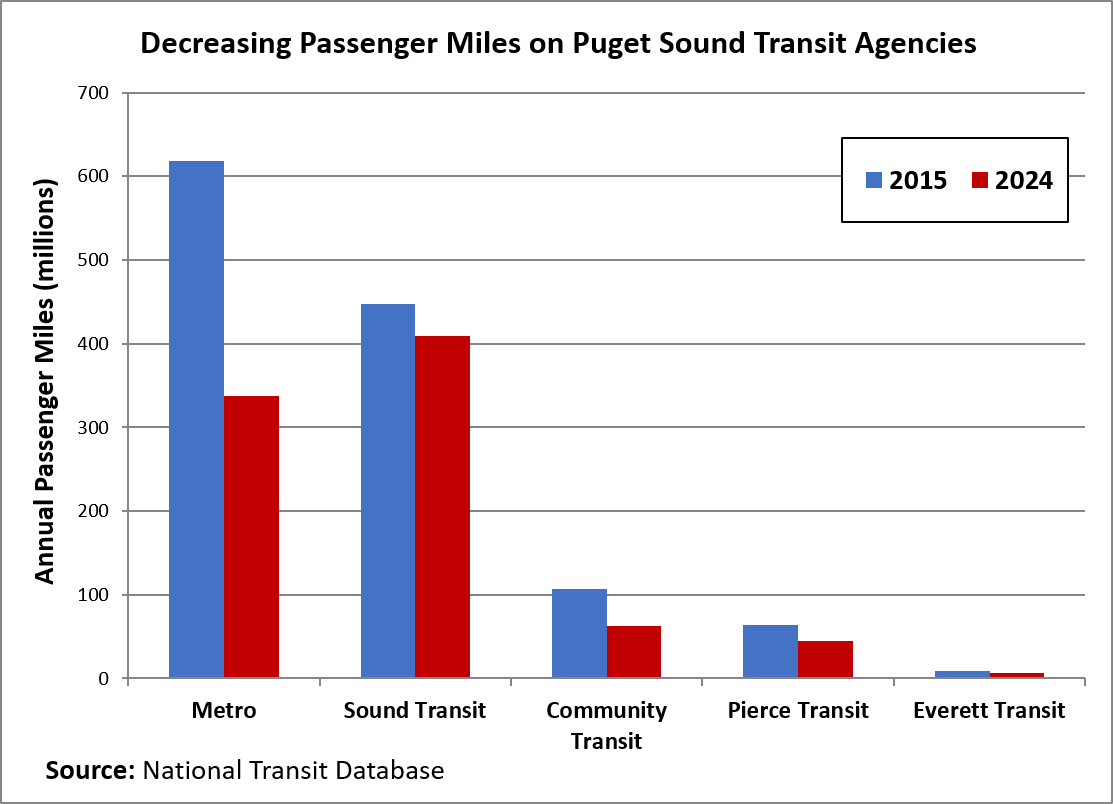
All of the agencies in the Puget Sound region reported fewer passenger miles in 2024 than they did in 2015. Even Sound Transit, which opened major light rail extensions to the University District, Northgate, Angle Lake, and between Bellevue and Redmond, reported a 9% decrease in passenger miles over those ten years. The drop-off was much worse for Metro, which saw passenger miles decrease by 45%. Some of that can be attributed to COVID and the reduction in downtown Seattle employment, but it also reflects the shift of bus riders to light rail. From 2015 to 2024 total transit passenger-miles in the Puget Sound region fell by 31%. This decrease is all the more concerning because the population of the Puget Sound region grew by more than a half million residents during the same ten year period, but that increase, about 14%, did not result in a proportionate increase in ridership.
A third way of measuring transit performance is mode share, which is usually expressed as the percentage of daily trips in the region using public transportation. Transit accounted for about 4% of trips Puget Sound area residents took in 2014 (that includes commuting to work, school trips, shopping, everything). The Puget Sound Regional Council (PSRC) forecasts transit mode share will rise only slightly to 4.7% by 2050, but as shown above, the region is not on track to achieve even that very modest increase. In fact, transit mode share today has decreased and now constitutes less than 3% of all trips, and light rail, which has been far and away the region’s largest transportation investment, carries less than 1% of trips in the region. In the optimistic PSRC forecast, which assumes full build-out of the ST3 plan, light rail still only accounts for a 2% mode share despite an investment estimated at over $150 billion.
The ridership trend, which is dismal no matter how you slice it, should be a concern to transit agency board members and the regional policy makers at PSRC. The data clearly shows the region’s massive transit investment is not producing the hoped-for results and is not addressing the region’s growing need for mobility. This question should be at the top of the agenda for Sound Transit, but in their recent “enterprise initiative” to revise the ST3 plan, the serious implications for the increasingly costly light rail plan received no attention. So far, no agency has stepped up to answer the question of how the 98% of regional trips that aren’t on light rail will be accommodated on a transportation system that is already straining under the current volume of traffic.