

Superintendent of Public Instruction Chris Reykdal argued on Facebook last week that Washington's budget problems are the result of the state's tax structure, not an oversized government. As evidence, he cited three statistics: fewer state employees per 1,000 residents than 20 years ago, state spending declining as a share of GDP, and average state employee pay growing more slowly than private-sector wages.
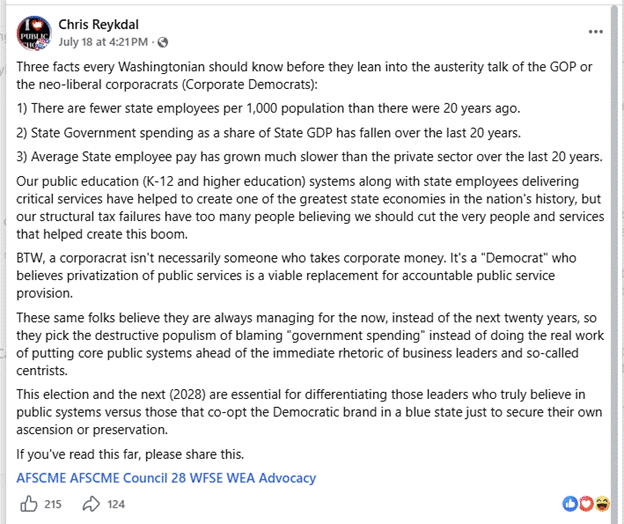
These claims come just weeks after the Office of Financial Management warned agency directors to prepare for "significant budget shortfalls" and said business as usual was over. If these three statistics are meant to justify Washington's current approach to budgeting, they deserve a closer look, as Superintendent Reykdal is not the only person pushing this narrative.
For starters, the largest increase in the 2025 operating budget went to employee compensation, about $3 billion, more than everything the budget cut combined. Lawmakers then approved roughly $9 billion in new taxes to help finance those raises and other policy choices. Reykdal's three statistics do little to explain those decisions. One is contradicted by the state's own employment data, one is technically true but answers the wrong question, and one compares state pay against wages heavily influenced by Washington's technology sector.
None address the measure taxpayers ultimately care about: what state government costs the people paying for it. By that measure, using the state's own data, government in Washington has grown faster than the taxpayers supporting it over the past two decades.
Net policy-level spending changes, 2025–27 operating budget

State employment didn't shrink, it kept pace with population
The Office of Financial Management counts state employees every year. In fiscal 2005 the state employed 106,769 people, including higher education. In 2025 it employed 138,109, a 29% increase that closely tracked Washington's roughly 30% population growth over the same period. That works out to about 17 state employees per 1,000 residents in both years.
The ratio dipped to about 15.5 after the Great Recession before gradually climbing back. In 2025 alone, the workforce grew 3.6% while the state's population grew about 1%.
Headcount per resident is not the most important measure, cost is, but it is enough to evaluate Reykdal's claim. The state's own figures do not show fewer employees per resident than 20 years ago. They show roughly the same number, with the ratio increasing in recent years.
State employees per 1,000 residents, 2005–2025
A bigger economy is not a mandate for bigger government
State spending declined as a share of GDP because Washington's economy expanded dramatically, from about $293 billion in 2005 to roughly $895 billion in 2025. That expansion was driven in part by the rapid growth of the state's technology sector. The information industry alone now accounts for roughly $160 billion in annual output, about triple its size a decade ago.
Reykdal presents the declining share of GDP as evidence of fiscal restraint. But measuring government against GDP implicitly treats faster economic growth as evidence that government has become relatively smaller, even if the cost borne by taxpayers continues to rise.
Nothing about a larger economy requires government spending to grow alongside it. What matters to taxpayers is not how large the economy becomes, but what government costs them and what they receive in return. A booming technology sector does not automatically justify a larger public sector.
Reykdal treats a falling spending-to-GDP ratio as evidence the state should spend more. But follow that logic consistently and you're committed to rapidly expanding government in almost every year the economy grows. The only time the ratio rises on its own, the only time his own measure would admit government had grown, is a recession like 2008 or 2020, when the economy stalls but spending keeps climbing anyway. In other words, maintaining a constant share of GDP requires government to grow almost continuously, regardless of whether existing spending levels are meeting public needs.
There is also a mechanical reason government's share of GDP naturally tends to decline. Government services rely heavily on labor: teachers, nurses, troopers, and caseworkers. It is far easier for a technology company to double its output than for a caseworker to become twice as productive. Even if government spending grows steadily, a technology-driven economy can outpace it, causing spending as a share of GDP to fall almost automatically.
Ask instead the question that ultimately matters: what does state government cost the people paying for it?
Using OFM's own inflation-adjusted data, real state and local government taxation per resident has increased by roughly 44% since 2004. Government became more expensive for taxpayers even as it declined relative to GDP. The technology boom made the denominator grow faster, not government smaller.
State and local taxes and revenues per resident, 2004–2023

The workforce costs far more than growth alone explains
The comparison between public and private wages relies on the same technology-driven averages. Washington's average annual wage exceeded $95,000 in 2024, but that figure is heavily influenced by a relatively small number of exceptionally high earners. The median worker earns closer to $63,000, and in 23 of Washington's 39 counties the average wage remains below $60,000, while King County exceeds $120,000.
Whether state employee wages have risen more or less quickly than private-sector wages says little about whether the state's workforce has become more affordable. Taxpayers do not pay private-sector wages; they pay the state's payroll. The relevant question is how much that payroll has grown and whether its growth can be explained by serving a larger and more expensive state.
To that end, the state's wage bill grew from roughly $5 billion in 2004 to nearly $13 billion in 2025, an increase of about 150%.
State government wage compared with population growth plus inflation, 2004 and 2025

Population growth and inflation are not a perfect benchmark for workforce costs, but they provide a useful baseline for evaluating long-term trends. Together they would account for roughly 125% growth over the same period. The remaining difference amounts to roughly $1.2 billion in additional annual wages beyond what population growth and inflation alone would explain.
This comparison also excludes major components of compensation. State employees receive defined-benefit pensions and participate in a health insurance system in which the state pays roughly 85% of premiums, benefits that many private-sector workers do not receive. The 2025 operating budget included 3% and 2% general wage increases, more than 330 targeted salary increases, an $18-per-hour wage floor, and more than $300 million to maintain the state's growingly more expensive 85/15 health insurance premium split.
Lawmakers also reduced near-term pension contributions by gaming the actuarial assumptions, lowering required contributions by roughly $489 million while shifting those costs into future budgets, according to the state actuary.
Conclusion
Each of Reykdal's three statistics compares government with a benchmark that expanded unusually quickly: population, GDP, or average wages boosted by Washington's technology sector. Those comparisons miss the question taxpayers ultimately care about: what government costs relative to the people paying for it.
By that measure, using the state's own figures, government has become substantially more expensive over the past two decades.
That helps explain why the Office of Financial Management is warning agencies to prepare for structural budget shortfalls despite record tax increases. Current revenue projections indicate the 2027–29 operating budget can grow by just 2.5% over current spending across the biennium, the slowest projected growth outside the Great Recession, while inflation alone is expected to rise several times faster. Those projections also assume the state's new income tax remains in place.
Reykdal argues Washington's tax structure, not spending, is the central problem. The state's own budget data point in the opposite direction.