


Washington’s budget problem is usually described by the majority party and other supporters of tax increases as a shortage of revenue. The evidence shows something different, as even rapid revenue growth and billions in new taxes has not kept up with state spending.
These six charts show how we got here.
1. Spending is growing faster than revenue
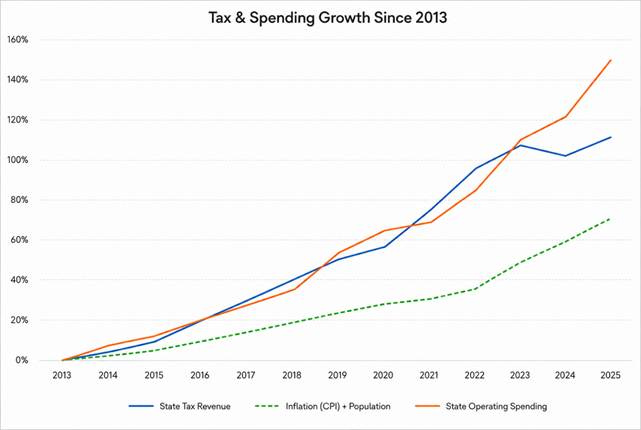
Washington’s tax collections grew 112% from 2013 to 2025. That should have provided substantial room for the budget to grow. Instead, spending grew 148%, outpacing revenue growth by 36% and population plus inflation by 77%.
The fiscal year 2025 endpoint also comes before the large tax increases enacted in 2025 and 2026 began producing revenue.
2. The taxes Washington already had were producing far more money

These three taxes alone produced about $15 billion more per year in 2025 than they did in 2013. Some of that growth reflects policy changes, particularly to the state property tax, but much of Washington’s tax structure also grows automatically with the economy: taxable sales rise, business receipts rise, and the property-tax base grows. The state was not operating with a stagnant revenue system before lawmakers began adding entirely new taxes.
3. Government is collecting far more per resident

State and local taxes per Washington resident increased from $5,363 in 2004 to $7,713 in 2023 after adjusting for inflation, a 44% real increase. Total government revenue per resident rose 42% over the same period.
Government was collecting substantially more from each resident in real terms, even before the major tax increases enacted in 2025 and 2026.
4. Population and inflation do not explain the increase

The current Near-General Fund-Outlook budget is $80.2 billion. If the 2013–15 budget had simply grown with population and inflation, the comparable 2025–27 amount would be roughly $54 billion, about $26 billion below actual spending. The gap reflects policy choices and program growth that population and inflation alone do not explain. In other words, these were choices made by the Legislature about where to spend tax dollars.
5. New tax increases are becoming larger and more frequent

The scale of tax increases on Washingtonians is changing sharply. The 2019 package was estimated at about $400 million per year; by 2025 lawmakers were adding roughly $3–4 billion per year, the largest tax increase in state history. In 2026 they followed with a 9.9% income tax and other B&O increases expected to raise another $2–3 billion per year once fully implemented.
6. Projected revenue cannot sustain recent spending growth

Even with income tax revenues included, projected 2027–29 revenue is about $82.2 billion against a current spending level of $80.2 billion, leaving only about $2 billion (2.5%) of room for growth over the next biennium before deficits emerge. That is far below both the 15.7% average biennial spending growth since 2017 and the 9.4% projected two-year inflation rate.
Conclusion
Taken together, these charts show a consistent pattern: Washington has collected substantially more from its existing taxes and repeatedly added new ones. Revenue growth has not closed the budget gap because spending has continued to grow faster.
This will continue in 2027 where, if the state grows the budget at the rate it’s been growing since 2017 (as seen in chart #6), the state will face a budget shortfall of around $7 billion.