

![]() Download a PDF of these Key Facts with sources and citations here.
Download a PDF of these Key Facts with sources and citations here.
Key Findings
Ben Franklin Transit 2009-2013
Declining ridership and increased spending
Total ridership has dropped 25% in five years
- Bus ridership is down 24%;
- Vanpool ridership is down 26%;
- Demand Response ridership is down 29%.
At the same time, operating costs are up by 4%, and spending
on salaries and benefits is up by 9%.
Total operating revenues are up 19%.
Introduction
New research released by Washington Policy Center (WPC) provides updated Key Facts on the mid-Columbia’s public transit system Ben Franklin Transit (BFT).
Ben Franklin Transit is a Public Transit Benefit Authority that serves the Tri-Cities region (Richland-Pasco-Kennewick Metro) by providing fixed route bus, demand response and vanpool services. Washington Policy Center first provided Key Facts about Ben Franklin Transit in 2011 – shining a light on the performance and operations of a transit agency that operates in one of the fastest-growing areas of the state.
The Tri-Cities region is now home to more than 250,000 people. With an ever-growing population, a healthy and accountable public transit system is needed. Our earlier study showed troubling trends at the transit agency from 1996 to 2009. Five years later, new research shows problems at Ben Franklin Transit continue, as officials collect more tax money than ever, even as the agency’s ridership falls.
BFT is now searching for a new Chief Executive Officer. As the agency prepares to hire a new leader, the Board of Directors has the opportunity to hire a CEO who will improve BFT’s outcomes and restore the public’s trust in the transit agency. This analysis contains key information and recommendations leadership can use to improve outcomes for BFT.
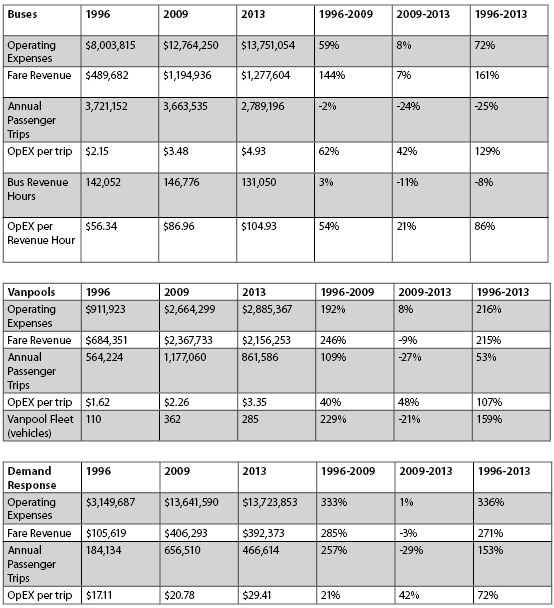
Background: BFT’s performance (2009 to 2013)
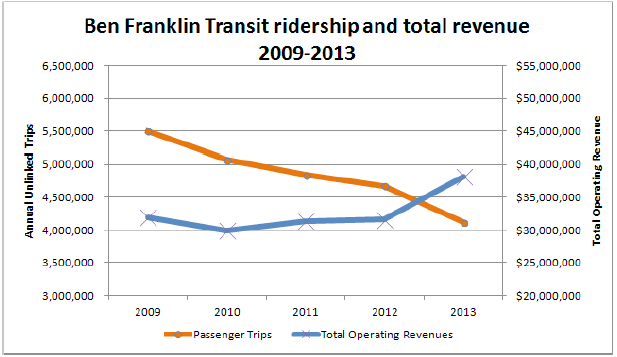
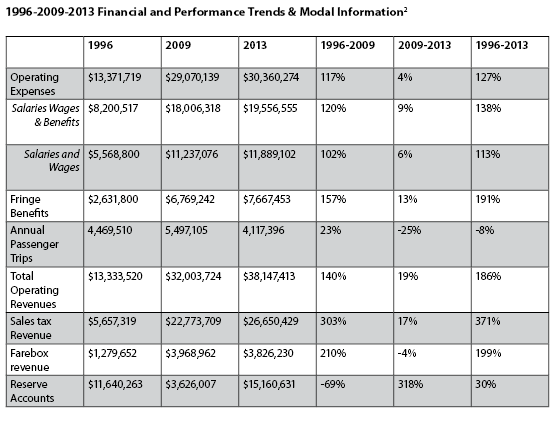
Between 2009 and 2013, Ben Franklin Transit experienced falling ridership across all travel modes, while both tax revenue and spending by agency officials increased. Total operating revenue increased 19 percent, bolstered by increased sales taxes collected from the public. Sales tax revenues are the largest funding source of Ben Franklin Transit’s budget. Money officials collected from passenger fares decreased by 4 percent. Transit officials received additional revenue from state and federal grants. Growing revenues have allowed Ben Franklin Transit to amass $15.1 million in reserves – a 318 percent increase over reserves of $3.6 million that officials held in 2009.
Despite the increase in revenue collections, passenger use of transit services decreased. Ridership on all Ben Franklin Transit services dropped by 25 percent, from 5.5 million passenger trips in 2009 to 4.1 million trips in 2013. In fact, Ben Franklin Transit officials are now serving fewer people than they did in 1996, when the area’s population was much smaller. The bulk of ridership losses have occurred on Ben Franklin Transit’s bus system.
At the same time, officials have increased their operating spending agency-wide by 4 percent over the five-year period, or by about $1.3 million. The salaries, wages and benefits officials decided to pay to personnel grew by $1.5 million. Salaries and wages grew 6 percent over five years despite serving fewer customers, but fringe benefit costs grew 13.2 percent. Since 1996, fringe benefit costs have soared 191 percent, four times the rate of inflation.
Bus Service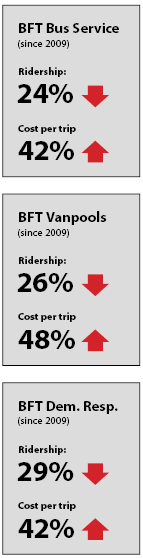
Since 2009, ridership on BFT buses has dropped by nearly a quarter. Some of that may be attributed to a cut in service. BFT officials provided 154,500 platform hours of bus service in 2009. By 2013, they provided 139,600 hours of service, a 10 percent reduction. Despite the bus cuts, costs to operate the bus system increased nearly 8 percent. As a result, Ben Franklin Transit’s cost to operate an hour of bus service jumped from $82 to $98, a 19 percent increase in cost with no expansion in hourly service. With costs increasing and ridership decreasing, the cost per passenger trip aboard a Ben Franklin Transit bus rose by nearly 42 percent over five years. It now costs $4.93 per passenger trip. Of the seven urban local bus agencies in Washington state, Ben Franklin Transit has the third highest cost per trip.
Taxpayers cover the bulk of that cost. The regular adult fare to ride a BFT bus is currently $1.50, but the average fare collected is only $0.46 per trip. Taxpayers subsidize the remaining $4.47 per trip.
Vanpools
Ben Franklin Transit officials have rightly received acclaim for their vanpool program, but between 2009 and 2013, operating expenses rose eight percent despite a 26 percent decrease in vanpool ridership. Costs per trip increased 48 percent over five years, from $2.26 in 2009 to $3.35 in 2013. Users still pay for most of operations, but expenses covered by users have dropped from 89 to 75 percent. Taxpayers covered $0.25 per trip in 2009, but by 2013 covered $0.85 per trip, a 235 percent increase. Of the six urban local transit agencies in Washington state that offer vanpools, Ben Franklin Transit’s vanpool program is the fourth most-used.
Demand Response
One bright spot for Ben Franklin Transit is that officials have been able to slow cost growth of their demand response service, but costs have increased 0.6 percent despite a ridership decline of 29 percent since 2009. Demand response service, also called Dial-A-Ride, is a door-to-door transit service, primarily utilized by the elderly and disabled. In 2009 it cost over $20 per trip made on BFT’s demand response service. By 2013 costs rose to $29 per trip, a 42 percent jump. Transit officials did contract out new feeder services, yet savings from the service were not enough to reduce overall costs in demand response services.
In 2013, Ben Franklin Transit’s demand response services represented 45 percent of the budget, yet only carried about 11 percent of passenger demand.
Recommendations
Transit officials should restructure their network to operate more efficiently. Ben Franklin Transit’s leadership has introduced new taxi feeder services to boost bus ridership and decrease costly demand response services. Instead of taking Dial-A-Ride from point to point, the taxi feeder takes people from their door to a bus route, and vise-versa. But the drop in demand response ridership has not correlated to a rise in bus ridership. In fact, both are falling. This provides Ben Franklin Transit officials an opportunity to improve their transit service to the public and provide working families some relief from the burden of the taxes they impose.
Costs at BFT continue to rise despite a significant drop in customer demand and extra revenue growth. While some ridership losses may be unavoidable, like shift changes at Hanford Nuclear Site, BFT should respond by allocating funds differently. Transit executives should work to reduce cost growth in personnel expenses, as fringe benefit costs and wage increases continue to outpace inflation. Spending increases benefit transit executives and employees, through more pay and better benefits, but does little to improve service to the public.
Ben Franklin Transit officials say they have changed the way they count vanpool ridership to comply with federal standards. According to BFT, previous vanpool ridership was overestimated, and the new numbers provided are more accurate. Accuracy is a good thing, and we commend BFT officials for striving to provide reliable data. However, other data provided to the National Transit Database still suggests weaker vanpool ridership. For example, the data show an 18 percent reduction in vanpool revenue hours, the amount vanpools are on the road.
The significant fall in passenger demand raises questions about the fairness of BFT’s taxing authority. Transit officials should always strive to provide taxpayers with the best value – including a reduction in the rate of taxes imposed on the public, when there is less need to collect so much money from area families and business owners.
Ben Franklin Transit’s policy of increasing operational spending as service hours and ridership decline raises questions about fiscal management at the agency. One question is particularly important: Is it fair for Transit executives to continue receiving record levels of tax revenue while the public’s need for transit services has fallen by 25 percent?
Even if bus ridership grew at a 1.5 percent annual rate, BFT would hit its 2009-level of bus ridership in the year 2033, 18 years from now. Ben Franklin Transit’s new CEO has a unique opportunity to improve outcomes and restore the public’s trust in the transit agency. Over the past five years ridership has dropped. Ben Franklin Transit should reexamine their service delivery to better meet new levels of passenger demand.
Note: All data used in this analysis comes from the National Transit Database and the Washington State Department of Transportation. 2014 data is not yet available and therefore, was not included in this analysis. However, we wanted to provide the newest data made available by the Washington State Auditor’s Office on 6/8/2015 and data provided in BFT’s 2015 Draft Transit Development Plan:
- Operating expenses in 2014 were 5.3% higher than 2013 (Source: SAO);
- Wages and benefits in 2014 were 7.1% higher than 2013 (Source: SAO);
- Sales tax revenues in 2014 were 9.1% over the budgeted amount (Source: SAO);
- Fare revenues in 2014 were 10.4% over 2013 (Source: SAO);
- 2,824,000 passenger trips on buses in 2014, up 1.2% from 2013 (Source: BFT).