


Last week, Idaho Congressman Mike Simpson released the broad outline of a proposal to spend $35 billion to destroy the four Lower Snake River dams, replace the lost electricity, and provide financial support for the farmers and communities that rely on Snake River navigation. Even though $35 billion could restore an enormous amount of salmon habitat in Idaho, Oregon, and Washington, the political symbolism of the Snake River dams has crowded out other important salmon recovery efforts in the minds of the public and journalists, to the detriment of salmon.One story about Simpson’s proposal is a good example of this frustrating reality.
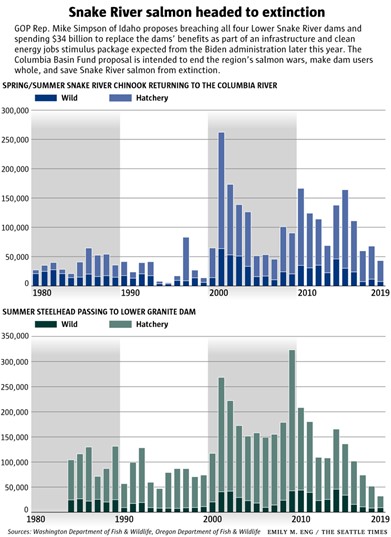 Writing about the proposal, a Seattle Times reporter supportive of destroying the dams included a graph titled “Snake River salmon headed to extinction” that purports to show a downward trend in salmon populations on the river. A close look at the graphs, however, show several problems, including data that are hidden and conflating regional trends with those on the Snake River. Here are three important problems with these two graphs.
1. The data ignore 2020
Both graphs end in 2019. Why? It isn’t for a lack of data. The 2020 data are easily available here.
The reason 2020 is left off is because the numbers don’t fit the trend. Snake River salmon returns were higher in 2020 than 2019 for Chinook, sockeye, and steelhead.
Chinook runs were 39 percent larger than 2019. Wild steelhead returns were 65 percent higher.
Leaving off 2020 is misleading.
2. The data stop at the low-end of a cycle
One reason to stop at 2019 is that it is the worst year of a cycle. For example, the three poor years spanning 2017-19 are very similar to the three poor years in the mid-2000s. A graph that ended in 2007 would have shown a series of low years that could also have been labeled “Snake River salmon headed for extinction” only to see a significant rebound in the following years.
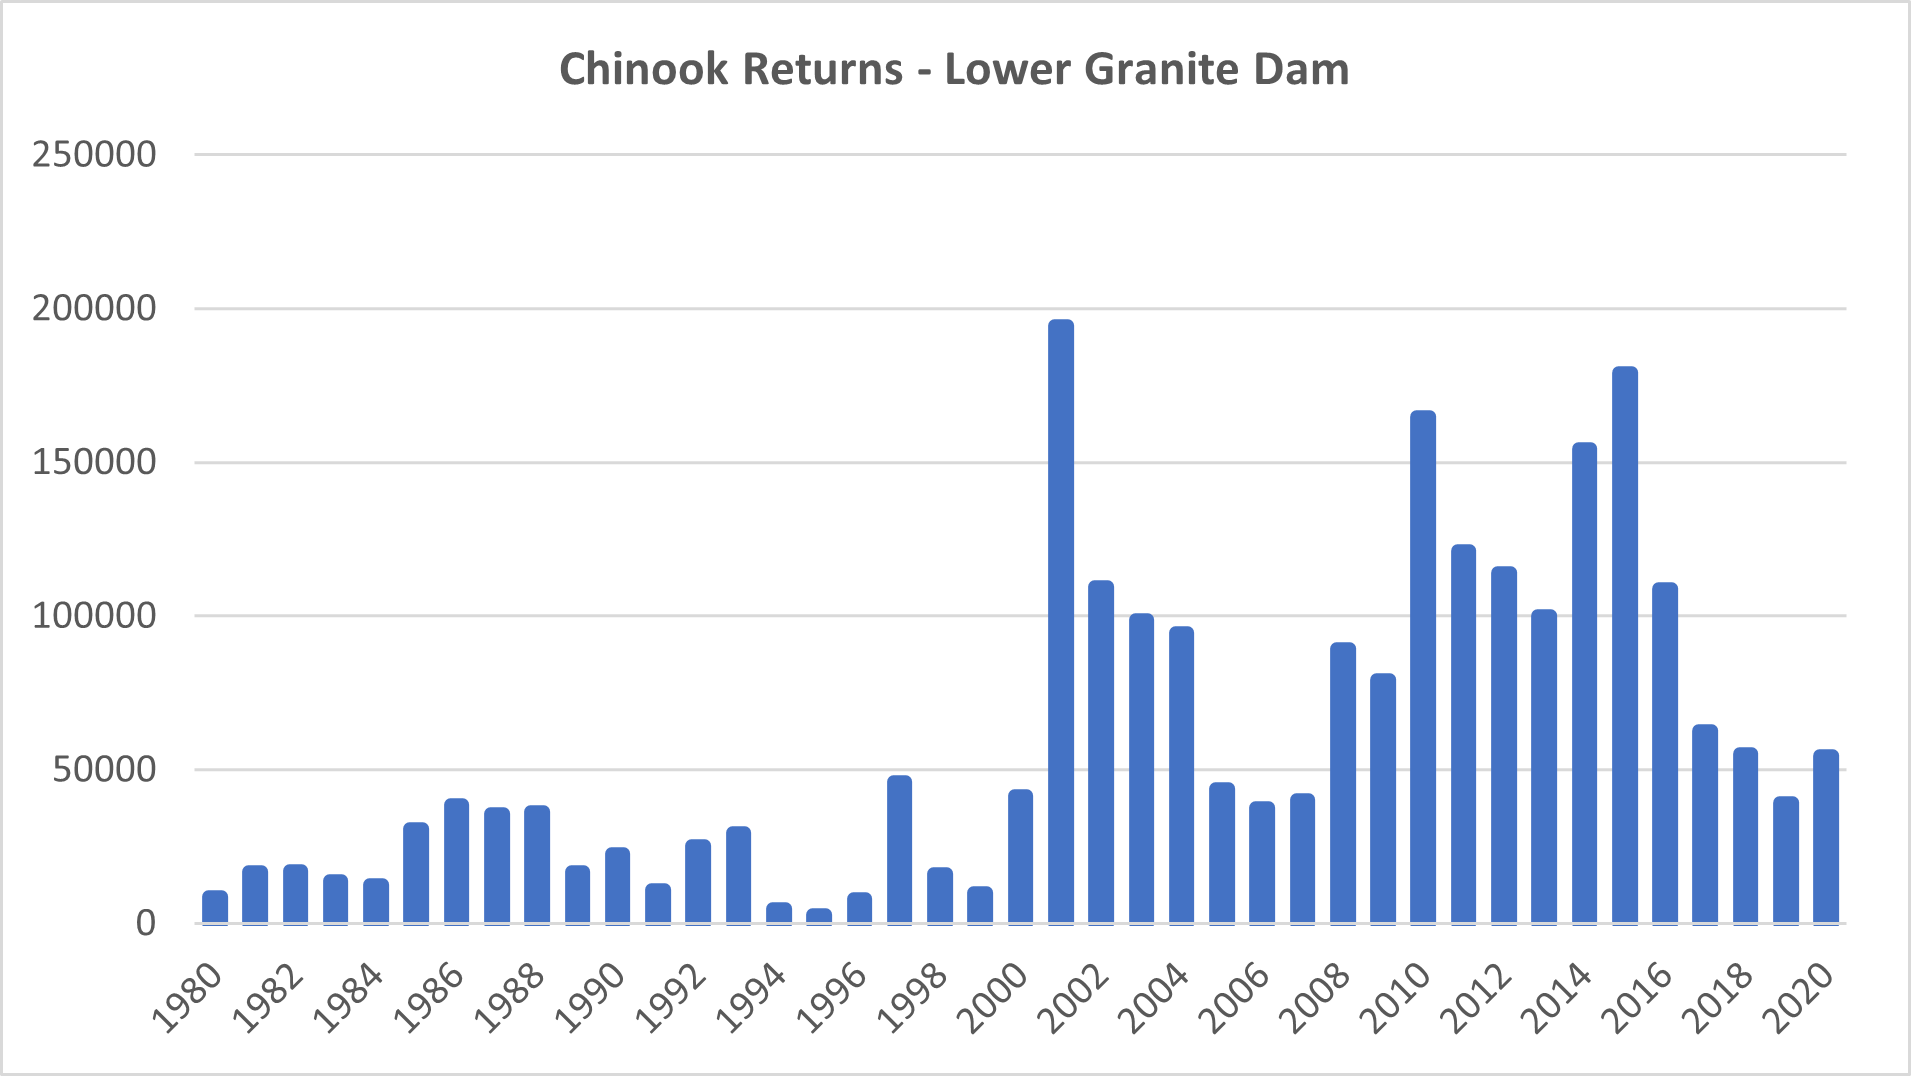 Indeed, returns began to recover in 2020 and returns of Jack Chinook – salmon that return a year early and can be indicative of future returns – point to a continued recovery in 2021.
3. The trends are region-wide
The insinuation of the graphs is that the four Lower Snake River dams are causing the population declines. Unfortunately, the challenges salmon face are region-wide.
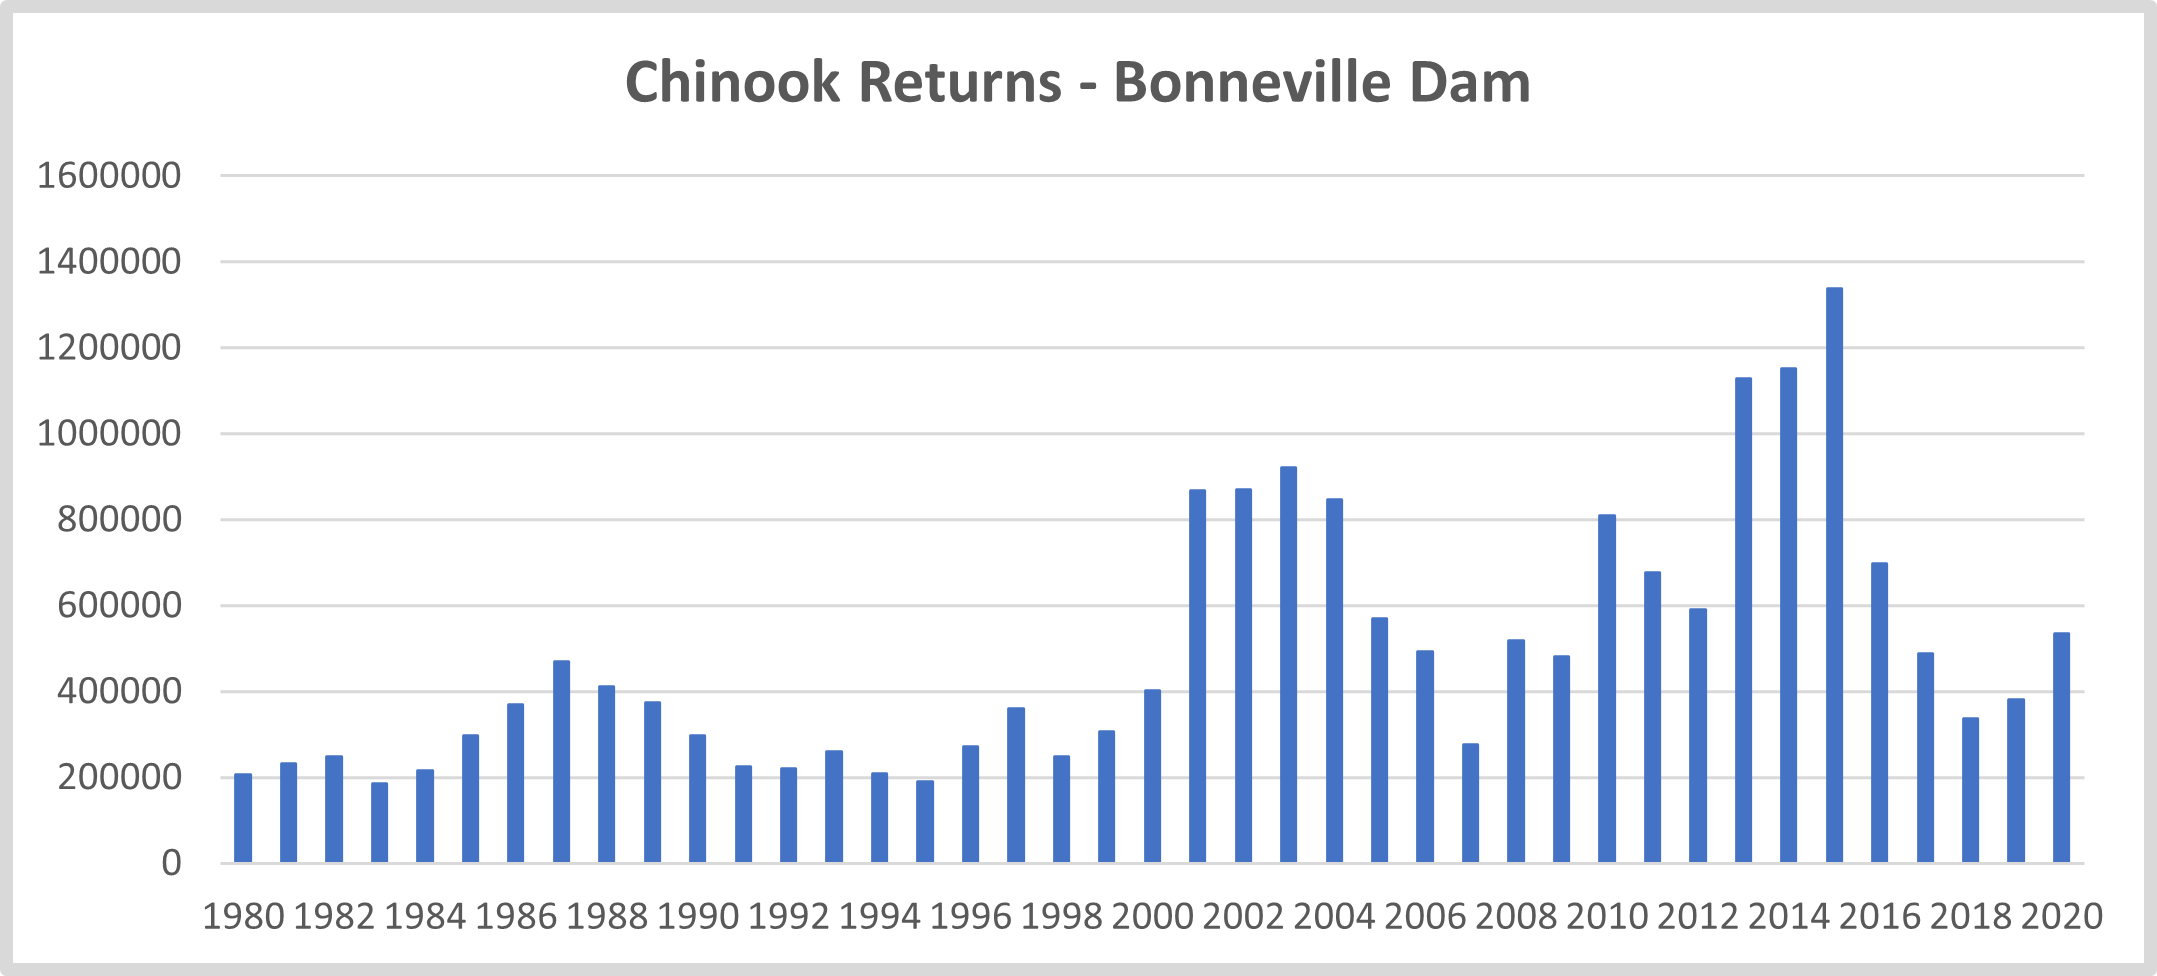 This graph is for all Chinook returning to the Bonneville Dam, which is the first dam salmon meet in the Columbia River. Note how similar it is to the Snake River Chinook graph from the Seattle Times. Snake River Chinook represent only about 10 percent of salmon returning to the Columbia, so the returns at Bonneville are driven by the larger trends. The fact that Snake River salmon returns mirror the larger Columbia system indicates the problem is larger and that focusing only on the Snake River is a distraction.
A scientific study released last year supports this hypothesis and highlights these larger problems. Noting regionwide trends, the study pointed to ocean conditions as a key driver of population declines. The authors wrote, “Within the Columbia River, the SARs [smolt-to-adult ratio] of Snake River populations, often singled out as exemplars of poor survival, are unexceptional and in fact higher than estimates reported from many other regions of the west coast lacking dams.” Spending $35 billion on to destroy the Snake River dams does nothing to address the most important factors facing salmon in the Snake and beyond.
A myopic focus on the Snake River is counterproductive to efforts to focus salmon-recovery resources where they are needed most. Manipulating data to mislead policymakers and the public undermines good science and contributes to bad public policy.