


Click here to download a PDF of this Policy Brief which includes sources and citations.
Click here to watch a 60-second video explaining cap-and-trade.
Five myths about the proposed Washington state cap-and-trade system
Key Findings
- Many of the arguments in support of a cap-and-trade system rely on arguments that are either inaccurate or have been proven wrong where cap-and-trade systems have been tried.
- The Energy Information Administration notes the economic downturn made the cap-and-trade system in the N.E. United States meaningless, keeping costs for carbon emissions low. With the growing economy, costs there are now rising rapidly.
- Washington State University research cited by supporters of cap-and-trade actually shows the entire cost imposed on “polluters” will be passed on to consumers.
- Despite the claim that a cap guarantees emissions reduction, political manipulation and the shifting of carbon emissions to other countries undermines the system, seriously limiting the effectiveness of carbon cap-and-trade systems in helping the environment.
- Increasing the price of gasoline is not a side effect of cap-and-trade, it is the goal. To reduce carbon emissions, cap-and-trade is designed to raise the price of gas so drivers modify their behavior, finding ways to use less gas. Claiming that gas prices would not go up is not merely incorrect, it is at odds with the policy goal of cap-and-trade.
- Based on past experience, cap-and-trade would cause some energy-intensive companies simply to shift operations out of the state. In these instances, the governor’s system would be a lose-lose for the state economy and for the global environment.
Introduction
As part of his effort to cut state carbon emissions, Governor Inslee announced legislation to establish a “cap-and-trade” system in Washington state. The governor and supporters of the system argue the system would cut carbon emissions and, rather than hurting job creation and economic growth, would actually help the economy.
Cap-and-trade is a system to cut carbon emissions by setting a statewide cap for total emissions. It requires companies to purchase a limited number of permits to emit carbon and allows them to buy or sell permits from other companies as needed. The claim is that a hard cap ensures emissions reduction.
Unfortunately, many of the claims advocates make about the cap-and-trade concept are based on myths that are refuted by real-world experience with cap-and-trade systems.
Here are five of the top myths most commonly heard about Governor Inslee’s proposal.
Claim: “A cap on carbon emissions guarantees emissions reduction.”
The most notable existing carbon cap-and-trade system is the one created by the Kyoto Protocol and implemented primarily in Europe. After years in place, how did it perform? Not well.
Prior to the economic downturn, European countries were on track to miss their cap-and-trade targets. From 2000, the year after the Kyoto Protocol was ratified, until 2007, the year before the economic downturn, total European emissions actually increased. As a result of the economic downturn, emissions fell more than 9 percent between 2008 and 2009, putting European Union countries into compliance.
The Kyoto system, however, produced few emissions reductions. European government officials, facing political pressure from special interests, handed out free emission credits to industries they feared would leave and go to countries not covered by the cap-and-trade system.
Without the unexpected intervention of a serious economic downturn, the most notable carbon cap-and-trade system in the world would not have achieved its targets.
In recent years, cap-and-trade’s performance has not gotten better. Earlier this year, European countries rejected a new system that would tighten the cap, attempting to smooth out the highs and lows in emission reduction. Some countries pushed back and a compromise was reached. The decision, however, was guided by politics and as difficulties emerged, emission targets and rules were changed accordingly. The political maneuvering undermined the effectiveness of the system.
As costs go up, political pressure to ease those costs does as well. In fact, when it was noted that both the University of Washington and Washington State University would see millions of dollars in additional costs due to Governor Inslee’s cap-and-trade proposal, some officials in Olympia immediately promised to simply increase the payments the state gives to the universities. The proposed system has not even been adopted and politicians are already promising to make exceptions for politically-favored interests.
What will happen when major job creators like aluminum plants in Ferndale or Wenatchee, threaten to leave the state unless they receive relief from cap-and-trade? The solar-panel manufacturer in Moses Lake and the semiconductor plant in Camas are in the same position. Will Olympia politicians stand by and watch those companies leave, taking their jobs and carbon emissions with them? That has not been the case under Kyoto in Europe and it is unlikely to be the case here.
Claim: “Cap-and-trade costs will hit ‘polluters,’ not poor and middle class families.”
This is a common refrain for the governor and other advocates of the cap-and-trade system. The governor’s spokesman David Postman told a local radio station that cap-and-trade would put “the carbon charge on big companies rather than [on] a gas tax which hits everyone.” When pressed, supporters admit that some of the costs may be passed along to consumers, but not all costs.
Two points stand out about this claim.
First, the cap-and-trade bill itself admits the policy is likely to “disproportionally impact low-income and other vulnerable communities.” This is such a significant concern, the bill would actually create a commission to study these impacts.
Second, the cap-and-trade system works very similarly to the gas tax, requiring oil refiners or shippers to submit the tax to the state. Both levies are based on the volume of gasoline sold. The only real difference is that a gas tax is consistent and the costs associated with cap-and-trade fluctuates over time.
From an economics standpoint, the question of how much of the tax is passed along to consumers is related to how sensitive market demand is to price, an effect known as “elasticity.” Demand for gasoline is relatively inelastic. People do not change their purchasing habits in the near-term when prices increase, they simply pay the higher price. As a result, a study from Washington State University notes, “consumers bear the full burden of a state [gas] tax,” finding that for every one cent increase in a gas tax, the retail price at the pump goes up by slightly more than one cent. The entire cost of cap-and-trade’s impact on gas prices will be borne by consumers.
Increasing the price of gasoline is not a side effect of cap-and-trade. It is the goal. To reduce carbon emissions, cap-and-trade is designed to raise the price of gas so drivers modify their behavior, finding ways to use less gas. Claiming that gas prices would not go up is not merely incorrect, it is at odds with the policy goal of cap-and-trade.
Claim: “The cap-and-trade system in the Northeastern United States, known as RGGI, is working at low cost.”
Advocates of cap-and-trade in Washington state argue that where it has been tried, the economy has not been damaged. The latest example they point to is the Regional Greenhouse Gas Initiative (RGGI) in the Northeastern United States. A quick look at the evidence, however, shows this claim is not true.
First, RGGI took effect in 2009, so most of the reduction in greenhouse gases in the region occurred 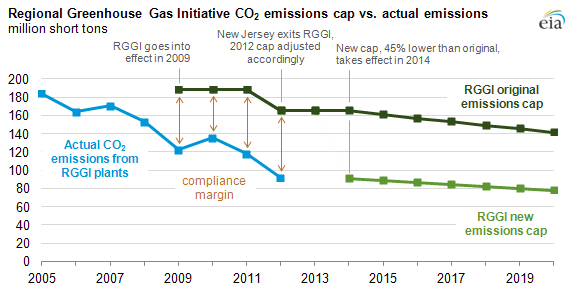 before the policy was in place – without a cap-and-trade system.
Second, as the U.S. Energy Information Administration notes, RGGI’s cap was set so high that it has not had any impact. Carbon emitters in the Northeast were already so far below the cap that measured reductions were the result of the economic downturn, not changes in technology or company behavior. Officials in RGGI states actually lowered the cap recently to conform with reality.
That conclusion is shared by Nate Silver’s data analysis project Five Thirty Eight – the organization that correctly predicted President Obama’s margin of victory in 2012. They noted, “RGGI’s market-based cap-and-trade program gave power plants no incentive to reduce their emissions because the cap amount simply was irrelevant.”
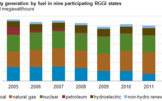 Finally, in addition to the economic downturn, RGGI states are relying on a carbon-reduction strategy that is not available in Washington state - switching energy production from coal to cleaner natural gas. Total energy use in RGGI states was constant between 2009 and 2012. What made the difference was the transition from coal to natural gas in electricity generation. Natural gas emits about half the carbon emissions per unit of energy as coal. As the Energy Information Administration notes:
“In 2005, which is when CO2 emissions in the RGGI states reached a peak, coal accounted for 23% of the regional generation mix and petroleum accounted for 12%. By 2012, coal’s share had declined to 9%, while the natural gas share had risen from 25% share in 2005 to 44%.”
Washington state has very little coal generation and where we already emit one-third less CO2 per capita than the national average due to abundant hydro and nuclear power. For that reason, cutting emissions in Washington state will be much more difficult and expensive.
Claim: “A low-carbon fuel standard complements cap-and-trade.”
In addition to cap-and-trade, the governor is advocating imposition of a low-carbon fuel standard (LCFS) he says complements that approach. The proposed LCFS would require reductions in the carbon content of gasoline, primarily by increasing the amount of biofuel mixed in with the gas.
In truth, a low-carbon fuel standard directly conflicts with cap-and-trade, adding costs for zero additional carbon reduction. As has been explained, the cap applies to oil companies and, by extension, to drivers. The LCFS adds nothing to that goal. In fact, the governor’s office specifically says that reductions from LCFS can be counted toward the cap in a cap-and-trade system, meaning they are not additional to cap-and-trade but within it.
One of the few benefits of a cap-and-trade approach, as opposed to technology mandates, is that families and companies can find ways to reduce carbon emissions that are more effective and inexpensive. That freedom and flexibility for consumers is the strongest argument for cap-and-trade. Governor Inslee echoed this argument when he announced his cap-and-trade proposal, telling reporters we “shouldn’t allow some bureaucrat...to pick winners and losers.”
A Low Carbon Fuel Standard does exactly that, by requiring vehicle fuels to meet an arbitrary government-set standard. The global climate doesn’t care how we cut carbon emissions. Politicians, on the other hand, care very much, for a variety of political reasons.
If the cost of an LCFS is low, then oil companies will naturally choose this approach as a way to limit their exposure to a cap-and-trade system. Rather than pay the price of a permit to emit carbon, they would pay the price to reduce the carbon content of the fuel they produce.
If, however, the cost of an LCFS is higher than the cost of a carbon emission permit or other emission reduction strategies, they would choose to buy the permit instead.
In either case, the total amount of carbon emissions is the same. The only thing an LCFS would do is require a particular approach to cutting emissions. This may benefit biofuel companies, but it would not help the environment and would needlessly add costs to consumers and businesses that use fuel.
Adding an LCFS to a mandated cap-and-trade system would increase costs but would do nothing to reduce overall carbon emissions.
Claim: “Cap-and-Trade won’t shift carbon emissions to other states and countries.”
Washington state already has experience with the practice of shifting carbon emissions off one balance sheet and then claiming carbon reduction.
In 2001, when electricity rates skyrocketed, there was a significant reduction in Washington’s carbon emissions. The reduction, however, was the result of energy-intensive industries, like aluminum plants, shutting down and moving elsewhere. The CO2 emissions associated with the production of those products simply moved elsewhere.
When Seattle City Light wanted to become “carbon neutral,” the primary tactic officials used was to end their contract to buy power generated by burning coal and to buy more electricity produced by hydro dams. This made Seattle’s balance sheet suddenly look nice, a fact they now proclaim with the “Nation’s Greenest Utility” logo emblazoned on City Light vehicles. The planet’s carbon emission balance sheet, however, was no different. The coal-generated energy was simply shifted elsewhere.
The governor’s cap-and-trade legislation has a contingency for these types of “trade-exposed” industries, creating a $20 million fund in the “carbon pollution competitiveness tax credit.” This, however, is a fraction of the total costs associated with a cap-and-trade system – which would be more than $400 million per year at the low-end cost projection.
Analysis of the Department of Ecology’s list of companies impacted by cap-and-trade shows how small this fund really would be. In future years when prices increased due to low snowpack or slow economic growth, the proposed $20 million fund would be entirely depleted by just two companies, even if we exclude refineries and oil transporters.
Based on past experience, cap-and-trade would cause some energy-intensive companies simply to shift operations out of the state, meaning fewer jobs, lower economic activity and lost tax revenue in Washington. The carbon emissions embodied in products shipped back into Washington state would not be covered by cap-and-trade. In these instances, the governor’s system would be a lose-lose for the state economy and for the global environment.
Conclusion
Cap-and-trade continues to be the preferred climate policy of the environmental left. The arguments they make to support it, however, are often incorrect or contradicted by experience. A serious approach to environmental policy and funding education should be built on more than the hope that it will work out better this time.
Appendix: Partial list of companies affected by proposed cap-and-trade system
The Department of Ecology released a list of companies that would be affected by the costs of the proposed cap-and-trade system. Although the Department says there are 130 companies that would be affected, its list includes only 94 companies. Using this list, and based on recent emissions reports, here are the companies that would be covered by cap-and-trade and the financial cost each would face, assuming three price levels per ton of carbon emission based on documented historical experience with carbon cap-and-trade.
The table is based on emissions reported to the state by companies in 2013, the most recent year available. Prices are based on the governor’s lowest estimate ($12/ton), the typical price in Europe and projected in California ($30/ton) and the highest cost experienced in Europe’s cap-and-trade system a decade ago ($45/ton).
Name | Sector | 2013 Total tons | $12/ton | $30/ton | $45/ton |
Agrium Kennewick Fertilizer Operations (KFO) - Kennewick | Chemicals | 160,410 | $1,924,920 | $4,812,300 | $7,218,450 |
Air Liquide Hydrogen Plant – Anacortes | Chemicals | 58,995 | $707,940 | $1,769,850 | $2,654,775 |
Alcoa Inc. - Wenatchee Works – Malaga | Metals | 312,298 | $3,747,576 | $9,368,940 | $14,053,410 |
Alcoa Intalco Works - Ferndale | Metals | 1,095,630 | $13,147,560 | $32,868,900 | $49,303,350 |
Ash Grove Cement Company – Seattle | Minerals | 354,767 | $4,257,204 | $10,643,010 | $15,964,515 |
Avista Corporation -WA State DOE Reporting - statewide | Petroleum and Natural Gas Manufacturing | 13,743 | $164,916 | $412,290 | $618,435 |
Boeing Commercial Airplanes - Everett | Manufacturing PaManufacturing ManufacturiManufacturing Manufacturing PulpdsfsManufacturing | 73,640 | $883,680 | $2,209,200 | $3,313,800 |
Boise Paper – Wallula | Pulp and Paper | 102,404 | $1,228,848 | $3,072,120 | $4,608,180 |
BP Cherry Point Refinery - Blaine | Refineries | 2,560,585 | $30,727,020 | $76,817,550 | $115,226,325 |
Cardinal FG Company - Winlock | Minerals Manufacturing | 103,290 | $1,239,480 | $3,098,700 | $4,648,050 |
Cascade Natural Gas Corporation - statewide | Petroleum and Natural Gas | 10,881 | $130,572 | $326,430 | $489,645 |
CertainTeed Gypsum - Seattle | Manufacturing | 35,460 | $425,520 | $1,063,800 | $1,595,700 |
ConAgra Foods Lamb Weston - Connell | Food Production | 39,839 | $478,068 | $1,195,170 | $1,792,755 |
ConAgra Foods Lamb Weston - Pasco | Food Production | 49,841 | $598,092 | $1,495,230 | $2,242,845 |
ConAgra Foods Lamb Weston - Quincy | Food Production | 39,844 | $478,128 | $1,195,320 | $1,792,980 |
ConAgra Foods Lamb Weston - Richland | Food Production | 34,223 | $410,676 | $1,026,690 | $1,540,035 |
Cosmo Specialty Fibers Inc - Cosmopolis | Pulp and Paper | 25,370 | $304,440 | $761,100 | $1,141,650 |
Emerald Kalama Chemical, LLC - Kalama | Chemicals | 66,742 | $800,904 | $2,002,260 | $3,003,390 |
Frederickson Power LP - Tacoma | Power Plant | 139,133 | $1,669,596 | $4,173,990 | $6,260,985 |
Gas Transmission Northwest, LLC - Compressor Station 6 - Rosalia | Petroleum and Natural Gas | 85,817 | $1,029,804 | $2,574,510 | $3,861,765 |
Gas Transmission Northwest, LLC - Compressor Station 8 - Wallula | Petroleum and Natural Gas | 99,503 | $1,194,036 | $2,985,090 | $4,477,635 |
Georgia-Pacific Consumer Products LLC - Camas | Pulp and Paper | 166,750 | $2,001,000 | $5,002,500 | $7,503,750 |
Georgia-Pacific Gypsum LLC - Tacoma | Manufacturing | 45,050 | $540,600 | $1,351,500 | $2,027,250 |
Goodrich Spokane, Landing Systems, Carbon Products - Spokane | Manufacturing | 27,972 | $335,664 | $839,160 | $1,258,740 |
Graymont Western US. Inc. - Tacoma | Minerals | 92,857 | $1,114,284 | $2,785,710 | $4,178,565 |
Grays Harbor Energy Center - Elma | Power Plant | 579,531 | $6,954,372 | $17,385,930 | $26,078,895 |
JR Simplot - Moses Lake | Food Production | 39,280 | $471,360 | $1,178,400 | $1,767,600 |
JR Simplot – Othello | Food Production | 80,520 | $966,240 | $2,415,600 | $3,623,400 |
Kaiser Aluminum Washington, LLC (Trentwood Works) - Spokane Valley | Metals | 110,960 | $1,331,520 | $3,328,800 | $4,993,200 |
Linde Gas North America LLC, Anacortes Hydrogen Plant - Anacortes | Chemicals | 41,885 | $502,620 | $1,256,550 | $1,884,825 |
Longview Fibre Paper and Packaging, Inc - Longview | Pulp and Paper | 194,059 | $2,328,708 | $5,821,770 | $8,732,655 |
McCain Foods - Othello | Food Production | 80,872 | $970,464 | $2,426,160 | $3,639,240 |
Moses Lake Facility of Basic American Foods - Moses Lake | Food Production | 28,289 | $339,468 | $848,670 | $1,273,005 |
Northwest Pipeline C/S - Goldendale | Pipeline Transportation of Natural Gas | 34,943 | $419,316 | $1,048,290 | $1,572,435 |
Northwest Pipeline C/S - Mount Vernon | Pipeline Transportation of Natural Gas | 27,159 | $325,908 | $814,770 | $1,222,155 |
Northwest Pipeline C/S - Snohomish | Pipeline Transportation of Natural Gas | 33,080 | $396,960 | $992,400 | $1,488,600 |
Northwest Pipeline C/S - Sumas | Pipeline Transportation of Natural Gas | 75,925 | $911,100 | $2,277,750 | $3,416,625 |
Northwest Pipeline C/S - Washougal | Pipeline Transportation of Natural Gas | 24,614 | $295,368 | $738,420 | $1,107,630 |
Northwest Pipeline Roosevelt C/S - Bickleton | Pipeline Transportation of Natural Gas | 28,099 | $337,188 | $842,970 | $1,264,455 |
Northwest Pipeline Willard C/S - Cook | Pipeline Transportation of Natural Gas | 27,209 | $326,508 | $816,270 | $1,224,405 |
Nucor Steel Seattle, Inc, - Seattle | Iron and Steel Mills | 128,706 | $1,544,472 | $3,861,180 | $5,791,770 |
PacifiCorp Energy - Chehalis Generating Facility - Chehalis | Power Plant | 678,947 | $8,147,364 | $20,368,410 | $30,552,615 |
Phillips 66 Ferndale Refinery - Ferndale | Refineries | 768,857 | $9,226,284 | $23,065,710 | $34,598,565 |
Port Townsend Paper Corporation - Port Townsend | Pulp and Paper | 77,535 | $930,420 | $2,326,050 | $3,489,075 |
Puget Sound Energy - Encogen Generating Station - Bellingham | Power Plant | 128,591 | $1,543,092 | $3,857,730 | $5,786,595 |
Puget Sound Energy - Ferndale Generating Station - Ferndale | Power Plant | 395,294 | $4,743,528 | $11,858,820 | $17,788,230 |
Puget Sound Energy - Frederickson Generating Station - Tacoma | Power Plant | 34,536 | $414,432 | $1,036,080 | $1,554,120 |
Puget Sound Energy - Fredonia Generating Station - Mount Vernon | Power Plant | 82,395 | $988,740 | $2,471,850 | $3,707,775 |
Puget Sound Energy - Goldendale Generating Station - Goldendale | Power Plant | 544,838 | $6,538,056 | $16,345,140 | $24,517,710 |
Puget Sound Energy - Mint Farm Generating Station - Longview | Power Plant | 574,901 | $6,898,812 | $17,247,030 | $25,870,545 |
Puget Sound Energy - Sumas Generating Station - Sumas | Power Plant | 100,998 | $1,211,976 | $3,029,940 | $4,544,910 |
Puget Sound Energy -Whitehorn Generating Station - Blaine | Power Plant | 28,667 | $344,004 | $860,010 | $1,290,015 |
Puget Sound Energy LDC - statewide | Petroleum and Natural Gas | 164,710 | $1,976,520 | $4,941,300 | $7,411,950 |
REC Silicon - Moses Lake | Metals | 140,674 | $1,688,088 | $4,220,220 | $6,330,330 |
River Road Generating Plant - Vancouver | Power Plant | 668,310 | $8,019,720 | $20,049,300 | $30,073,950 |
Saint-Gobain Containers, Inc. - Seattle | Minerals | 80,742 | $968,904 | $2,422,260 | $3,633,390 |
Shell Puget Sound Refinery - Anacortes | Refineries | 2,002,799 | $24,033,588 | $60,083,970 | $90,125,955 |
Simpson Tacoma Kraft Co LLC - Tacoma | Pulp and Paper | 113,902 | $1,366,824 | $3,417,060 | $5,125,590 |
Solvay Chemicals, Inc. - Longview | Chemicals | 47,279 | $567,348 | $1,418,370 | $2,127,555 |
Tesoro Corporation - Anacortes Refinery - Anacortes | Refineries | 1,169,253 | $14,031,036 | $35,077,590 | $52,616,385 |
The Boeing Company - Auburn | Manufacturing | 38,556 | $462,672 | $1,156,680 | $1,735,020 |
Tyson Fresh Meats, Inc. - Wallula | Food Production | 58,638 | $703,656 | $1,759,140 | $2,638,710 |
U.S. Oil & Refining Co. - Tacoma | Refineries | 168,827 | $2,025,924 | $5,064,810 | $7,597,215 |
University of Washington Seattle Campus - Seattle | Government | 90,334 | $1,084,008 | $2,710,020 | $4,065,030 |
WaferTech LLC - Camas | Manufacturing | 116,001 | $1,392,012 | $3,480,030 | $5,220,045 |
Washington State University - Pullman | Government | 60,794 | $729,528 | $1,823,820 | $2,735,730 |
Western Avenue Steam Plant - Seattle | Power Plant | 74,626 | $895,512 | $2,238,780 | $3,358,170 |
Weyerhaeuser NR Company - Longview | Pulp and Paper | 357,512 | $4,290,144 | $10,725,360 | $16,088,040 |
Wheelabrator - Spokane | Waste | 104,459 | $1,253,508 | $3,133,770 | $4,700,655 |
Associated Petroleum Products, Inc | Transportation Fuel Supplier | 1,018,701 | $12,224,412 | $30,561,030 | $45,841,545 |
Avfuel Corporation | Transportation Fuel Supplier | 67,999 | $815,988 | $2,039,970 | $3,059,955 |
CHS Inc. | Transportation Fuel Supplier | 604,402 | $7,252,824 | $18,132,060 | $27,198,090 |
City Service Valcon LLC | Transportation Fuel Supplier | 309,727 | $3,716,724 | $9,291,810 | $13,937,715 |
ExxonMobil Oil Corporation | Transportation Fuel Supplier | 901,783 | $10,821,396 | $27,053,490 | $40,580,235 |
IPC (USA), Inc. | Transportation Fuel Supplier | 321,387 | $3,856,644 | $9,641,610 | $14,462,415 |
SEI Fuel Services, Inc. | Transportation Fuel Supplier | 334,295 | $4,011,540 | $10,028,850 | $15,043,275 |
Southern Counties Oil Co Ltd | Transportation Fuel Supplier | 112,978 | $1,355,736 | $3,389,340 | $5,084,010 |
Targa Sound Terminal | Transportation Fuel Supplier | 11,292 | $135,504 | $338,760 | $508,140 |
The Boeing Company | Transportation Fuel Supplier | 126,519 | $1,518,228 | $3,795,570 | $5,693,355 |
United Parcel Service Co | Transportation Fuel Supplier | 47,767 | $573,204 | $1,433,010 | $2,149,515 |
UPS Fuel Services, Inc | Transportation Fuel Supplier | 31,599 | $379,188 | $947,970 | $1,421,955 |
Valero Marketing and Supply Company | Transportation Fuel Supplier | 118,537 | $1,422,444 | $3,556,110 | $5,334,165 |
Vitol Inc | Transportation Fuel Supplier | 438,642 | $5,263,704 | $13,159,260 | $19,738,890 |
Western Petroleum Company | Transportation Fuel Supplier | 18,735 | $224,820 | $562,050 | $843,075 |
Wilson Oil Inc. | Transportation Fuel Supplier | 1,150,815 | $13,809,780 | $34,524,450 | $51,786,675 |
World Fuel Services, Inc. | Transportation Fuel Supplier | 230,215 | $2,762,580 | $6,906,450 | $10,359,675 |