Related Articles

Key Findings
- C-TRAN’s annual operating costs have more than doubled (112%) since 1996.
- C-TRAN employee compensation costs rose from $10.3 million in 1996 to $28.3 million in 2010, an increase of 174%.
- Inflation over the same time period was only 39%, which means C-TRAN officials increased employee compensation more than four times faster than the rate of inflation since 1996.
- C-TRAN’s share of wages on its total operating budget (78%) is now the highest of all urban transit agencies in Washington state.
- The large and rapid growth in C-TRAN’s operating expenses stands in stark contrast to the modest growth in average daily ridership, which has risen less than 6% since 1996.
- Residents living within the C-TRAN service area make an estimated 1.4 million person trips per day. This means C-TRAN serves only 1.6% of all daily person trip demand.
- Despite the poor growth in passenger demand, C-TRAN’s cumulative capital expenses have amounted to more than $100 million since 1996.
Introduction
New research released by Washington Policy Center, a non-partisan, public policy think tank with offices in Seattle, Olympia, Spokane and the Tri-Cities, provides key facts about the Clark County Public Transportation Benefit Area Authority (C-TRAN).
C-TRAN is a Public Transportation Benefit Authority and serves the southwest region of Washington state. C-TRAN provides fixed route bus, demand response and vanpool services to residents in or near the cities of Vancouver, Washougal, Battle Ground, Yacolt, Ridgefield and La Center. C-TRAN also provides some transit connections to downtown Portland, Ore., across the Columbia River Bridge. The entire service area includes a population of about 367,000 residents, which makes C-TRAN the sixth largest transit service area in Washington.
C-TRAN’s governing body is a nine-member board of directors made up of local elected officials.
In 2010, C-TRAN’s total operating expenses were $36.1 million, with users paying about 20%, or $7.2 million, of that in transit fares. The total system served about 6.6 million passenger trips for an average of 21,947 passenger trips per weekday. In 2010, the agency lost about $28.9 million, or $4.42 per passenger trip. Like all transit agencies, C-TRAN is not able to fully pay for its operating expenses through fares so these operating losses are subsidized by taxpayers, mostly through higher local sales taxes.
In 2011, voters approved a sales tax increase to further subsidize transit services. This year C-TRAN officials are expected to ask voters again for an additional sales tax increase to expand services, mostly to pay for operating a new light rail line across a new Columbia River bridge to Oregon.
However, a careful review of C-TRAN’s annual performance shows there are several areas of concern of which voters should be aware.
From 1996 to 2010, C-TRAN officials more than doubled the agency’s annual operating expenses from $17 million per year to $36 million per year. This is an increase of 112% in 14 years.
Virtually all of the growth (94%) in C-TRAN’s operating expenses over this time period was in the category of wages, salaries and benefits. Employee compensation costs rose from $10.3 million in 1996 to $28.3 million in 2010, an increase of 174%.
To put this in perspective, inflation over the same time period was only 39%. This means C-TRAN officials increased employee compensation more than four times faster than the rate of inflation since 1996.
C-TRAN officials have doubled workers’ average annual salaries, which have risen from $24,630 per employee in 1996 to $48,926 per employee by 2010.
In 1996, there were only two C-TRAN employees who received more than $75,000 per year in wage compensation, for a total annual cost of about $163,000. By 2010, the number of these higher-wage employees had grown to 21 and now cost taxpayers more than $1.8 million per year.
Remarkably, wages and benefits now represent 78% of C-TRAN’s total annual operating expenditures. This proportion is 29% higher than it was in 1996, when C-TRAN’s wages and benefits only made up about 61% of the agency’s total annual operating budget.
Out of the agency’s total $36.1 million annual operating budget, C-TRAN officials have only $7.8 million per year to spend on transit services other than employee wages.
C-TRAN’s share of wages on its total operating budget (78%) is now the highest of all urban transit agencies in Washington state.
The large and rapid growth in C-TRAN’s operating expenses is extraordinary and stands in stark contrast to the modest growth in transit ridership over the same time period.
In 1996, C-TRAN officials served about 6.1 million passenger trips. By 2010, C-TRAN transit services carried 6.6 million passenger trips, an increase of just 6.6%. Average weekday ridership has grown from 20,722 trips per day in 1996 to only 21,947 trips per day by 2010.
Residents living within the C-TRAN service area make an estimated 1.4 million person trips per day. This means C-TRAN serves only 1.6% of all daily person trip demand.
Despite the poor growth in passenger demand, C-TRAN’s cumulative capital expenses have amounted to more than $100 million since 1996, even though C-TRAN is carrying about the same number of people as it did in 1996.
Annual expenses rising disproportionally faster than ridership lead to degradation in C-TRAN’s service efficiency and cost effectiveness. C-TRAN’s cost of operating its bus fleet, the agency’s largest transit service, has risen from $2.37 per trip in 1996, to $4.47 in 2010, an increase of 89%. Another common transit efficiency measure is operating cost per vehicle revenue mile, which for C-TRAN has risen 65% over the same time period.
Given the likelihood of a second ballot measure asking voters for another tax increase in just two years, C-TRAN officials may reasonably be challenged to justify the meteoric rise in annual operating costs and the significant capital expenditures amid relatively slow growth in transit demand.
The following data illustrates key performance measures of the C-TRAN system:
Primary C-TRAN Modes
- Buses: Vehicles operated by a paid transit driver over a fixed route. Bus routes can be located in dense urban cores or over long distances connecting population centers.
- Vanpools: Vans operated by a volunteer driver and passengers who share a common origin and destination. Vanpools generally serve intercity commuters traveling to and from employment.
- Demand Response: Transit vehicles operated by a paid transit driver that can be requested by passengers and do not operate over a fixed route. Passengers sometimes have to meet certain criteria, such as low income or physical disabilities, to qualify for Demand Response service.
C-TRAN Taxing Authority and Funding
- Tax Authorized: 0.7% sales and use tax
- 0.3% imposed in November 1980
- 0.2% imposed in September 2005
- 0.2% imposed in November 2011
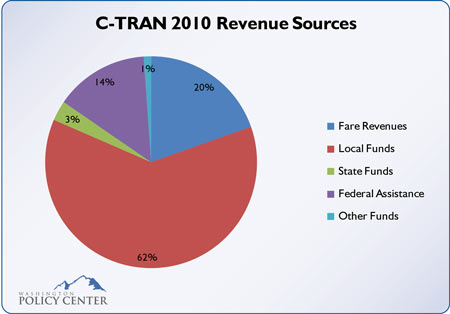
2010 Revenue Sources
- Fare Revenues: 20%, $7,177,150
- Local Funds: 62%, $22,697,699
- State Funds: 3%, $1,122,382
- Federal Assistance: 14%, $5,236,649
- Other Funds: 1%, $405,987
- Total Operating Funds Expended: $36,639,867
2010 Capital Expenses
- $7,075,971
1996–2010, Cumulative Capital Expenses
- $100,689,179
Key Modal Performance (2010)
| 2010 | Operating Expenses | Fare Revenues | Annual Unlinked Trips | Public Subsidy Required |
| Bus | $28,235,748 | $6,793,511 | 6,317,040 | $21,442,237 |
| Demand Response | $7,800,955 | $336,942 | 218,104 | $7,464,013 |
| Vanpool | $94,926 | $46,697 | 17,426 | $48,229 |
| Total: | $36,131,629 | $7,177,150 | 6,552,570 | $28,954,479 |
Source: 2010 National Transit Database
| 2010 | Operating Cost per Trip | Farebox Recovery Rate | Operating Subsidy per Trip |
| Bus | $4.47 | 24.06% | $3.39 |
| Demand Response | $35.77 | 4.32% | $34.22 |
| Vanpool | $5.45 | 49.19% | $2.77 |
Source: 2010 National Transit Database
Key Performance Trends (1996-2010)
| Total System | 1996 | 2010 | % change |
| Total Operating Expenses | $17,026,032 | $36,131,629 | 112.21% |
| Salaries/Wages/Benefits | $10,342,674 | $28,328,547 | 173.90% |
| Average Wages per Employee | $24,630 | $48,926 | 98.64% |
| Share of Wages on Total Operating Expenses | 60.75% | 78.40% | 29.07% |
| Employees Earning More Than $75k | 2 | 21 | 950.00% |
| Annual Cost of Employees Earning More Than $75k | $162,585 | $1,893,666 | 1,064.73% |
| Annual Passenger Trip Demand | 6,146,409 | 6,552,570 | 6.61% |
| Average Weekday Passenger Trips | 20,722 | 21,947 | 5.91% |
| Buses | 1996 | 2010 | % change |
| Operating Expenses | $14,209,482 | $28,235,748 | 98.71% |
| Annual Passenger Trip Demand | 5,985,456 | 6,317,040 | 5.54% |
| Operating Expense per Trip | $2.37 | $4.47 | 88.61% |
| Operating Expense per Vehicle Revenue Mile | $4.35 | $7.18 | 65.06% |
| Vanpools | 1996 | 2010 | % change |
| Operating Expenses | $68,544 | $94,926 | 38.49% |
| Annual Passenger Trip Demand | 18,458 | 17,426 | -5.59% |
| Operating Expense per Trip | $3.71 | $5.45 | 46.90% |
| Operating Expense per Vehicle Revenue Mile | $0.85 | $1.21 | 42.35% |
| Demand Response | 1996 | 2010 | % change |
| Operating Expenses | $2,747,996 | $7,800,955 | 183.88% |
| Annual Passenger Trip Demand | 142,495 | 218,104 | 53.06% |
| Operating Expense per Trip | $19.28 | $35.77 | 85.53% |
| Operating Expense per Vehicle Revenue Mile | $3.77 | $6.22 | 64.99% |
Source: 1996 & 2010 National Transit Database
Unless otherwise noted, transit data was obtained from the National Transit Database (1996 profile, 2010 profile) and directly from C-TRAN officials. The 1996 and 2010 transit profiles created by the NTD were the earliest and most recent years available. Individual wage data was provided to Washington Policy Center directly from C-TRAN officials. The wage data consists of total gross wages for every employee in 1996 and 2010. Total gross wages includes base pay and overtime.
Download a PDF of Key Facts about C-TRAN here.