About the Author

Related Articles

Relevant Topics
-
California
-
Charleston
-
Columbus
-
Intergovernmental Panel on Climate Change
-
Iran
-
King County
-
Los Angeles
-
menstruation
-
Mississippi
-
National Oceanic and Atmospheric Administration
-
Ohio
-
Oregon
-
Russia
-
Seattle
-
Spokane
-
United Nations
-
United States of America
-
University of Oregon
-
University of Washington
-
Vladimir Putin
-
Washington
-
Washington Policy Center
-
West Virginia
Click here to download a PDF of this Policy Note which includes sources and citations
Key Findings
- Governor Inslee’s climate change policy is based on a flawed University of Oregon study that used outdated projections.
- The latest science from the United Nation’s Intergovernmental Panel on Climate Change contradicts the University of Oregon study’s extreme climate projections.
- University of Oregon researchers misquoted the very studies they utilized for their conclusions. The study’s authors exaggerated by 90 percent the effects of the largest area of projected environmental impact.
- Recent warm summers have tested the University of Oregon claims using real-world data. None of the claims made by the University of Oregon on the health effects of changes in air quality have borne out, with asthma-related hospitalizations actually declining, exactly the opposite of what the study authors predicted.
Introduction
On April 29th, Governor Inslee announced his plan for reducing carbon emissions by signing an Executive Order on “Washington carbon pollution reduction and clean energy action.” To justify his plan, Governor Inslee cited the looming threat of climate change to Washington state. His Executive Order claims:
“WHEREAS, studies conducted by the University of Oregon found that the effects of climate change on water supplies, public health, coastal and storm damage, wildfires, and other impacts, will cost Washington almost $10 billion per year after 2020, unless we take additional actions to mitigate these effects.”
The projected $10 billion cost in Washington alone comes from a 2010 update to a larger 2009 study published by University of Oregon researchers. The 2009 study estimated the cost at $3.8 billion in 2020. The cost estimate in the 2010 revised study jumped dramatically with the inclusion of one new category, “Lost natural water storage,” which the authors estimate will cost $7.1 billion alone.
This $10 billion cost number has become a central talking point to justify high-cost climate policies, by arguing that even expensive policies would help avoid these significant impacts.
Even a cursory review of the University of Oregon study, however, shows how flawed these cost claims are. Examining one significant area of the study, “increased health-related costs,” shows that the authors of the study have not only exaggerated the impacts, they have actually misinterpreted the very studies they claim as their main information source.
Additionally, most of the data in the study is five years old. University of Oregon researchers do not use the latest climate information from the U.N.’s Intergovernmental Panel on Climate Change (IPCC), the source many on the left call the “climate consensus.”
Finally, recent warm summers have provided a real-world opportunity to test the cost predictions made in the University of Oregon study. Rather than increasing, health effects related to air quality have actually declined dramatically.
Washington Policy Center has long advocated a responsible and no-regrets policy on climate change that would address the real risks. Predictions that are wildly exaggerated, perhaps to make political points, undermine a commitment to science-based policymaking and make it more difficult to develop rational and effective policy that serves the public interest.
Use of outdated and extreme temperature projections
The estimate from the authors of the University of Oregon study is based on potential impacts drawn from the most extreme scenario included in the 2007 IPCC climate change model. This scenario, known as A1FI, is not only the most extreme – not the “likely” scenario as some advocates have claimed – it is also beyond any of the projections of the most recent IPCC report released in 2013. The highest temperature projections in the 2013 IPCC report, using a scenario called RCP 8.5, are a full 10 percent lower than the 2007 extreme A1FI.
Using this extreme scenario from 2007 made it difficult for the University of Oregon authors to find credible research to support it. The authors note repeatedly that they had to turn to studies using other scenarios, and then “adjust for higher temperatures expected in the A1FI scenario.” By choosing an extreme and unlikely outlier, the Oregon study’s numbers multiply the inherent uncertainty of the original studies with further uncertainty and embellishment.
To demonstrate how extreme the chosen A1FI scenario is, in the six full years since the projection was released by the IPCC, according to official NOAA data, global temperatures increased at a rate of just 0.1 degree Fahrenheit per decade, or about 13 percent of the projected rate. Even if temperature increases suddenly pick up, it is highly unlikely the extreme projection for 2020 will be reached. At current rates, the 2020 impact projections from the University of Oregon’s study are at least eight times too high.
Manipulated data on human health effects
To understand how inaccurate and misleading the University of Oregon estimate is, we can look at the area where they claim the greatest potential impact, human health.
Of the $2.3 billion in climate-related costs by 2020 claimed by the authors of the University of Oregon study, $1.3 billion (56 percent) is related to health costs. Most of those costs, $1.2 billion, are associated with increased low-altitude ozone.
To achieve this high number the study authors brazenly misquote studies and misuse the data.
For example, the study authors explain how they reached mortality estimates for increased ozone, noting “we apply findings from an assessment of the A2 scenario, which indicate elevated ozone levels related to climate change could increase nonaccidental mortality by 0.27 percent by 2050.” There are several problems with this approach.
First, they are unable to find an estimate associated with their chosen extreme temperature projections, so they are forced to extrapolate. As we noted, in an already uncertain estimate, this adds more uncertainty.
Second, the University of Oregon authors fail to note that the study focuses on cities in the eastern United States. They simply assume that temperature changes are associated with air quality changes in Seattle the same way they are in Columbus, Ohio or Charleston, West Virginia. No city west of the Mississippi is included.
Most manipulative, however, is how the authors mischaracterize the study. While they claim elevated ozone levels will increase “mortality by 0.27 percent,” the actual study says, “Elevated ozone levels correspond to approximately 0.11% to 0.27%.” Rather than providing the entire range, the authors cite only the most extreme end of the projections, potentially exaggerating the result by nearly 250 percent.
There are also problems associated with their estimate of increased morbidity. The University of Oregon authors fail to provide clear and complete explanations when they cite an estimate of “potential costs of increased morbidity.” They rely on a report “that concluded current hospitalization costs related to high ozone concentrations in California might triple under the A2 scenario.” This claim, however, is not backed up by their own source.
The paper from a non-profit group in California called Next 10, claims an increase in costs associated with ozone of a maximum of 14 percent and as little as 0.7 percent – not triple, as claimed. The University of Oregon authors may have some explanation for the wide variance between their claim and the clear numbers provided by the Next 10 paper, but they do not explain how they are able to make the claim that hospitalization rates might triple.
Further, the Next 10 report cited by the University of Oregon authors is not a study. Its authors do not explain their methodology or indicate how they arrived at their conclusions. Here is their entire explanation: “We estimate that the additional annual costs associated with an increase in ozone resulting from climate change ranges from $.5 billion to $10.2 billion, depending on the warming scenario.” They provide no explanation of their methodology, sources, notes or references. As a result, there is no way to determine the accuracy or reliability of these projections.
Additionally, it is unclear why the Next 10 report would apply to Washington state. It uses the most polluted city in the country, Los Angeles, as its model. It is simply assumed that air quality in Los Angeles is comparable to air quality in Seattle and Spokane, cities with different weather patterns more than 1,000 miles away. This is a tenuous assumption at best.
Ultimately, when assessing effects on human mortality and morbidity, the University of Oregon authors misquote the studies they cite, use only the most extreme projections, cite claims that are not backed up or sourced, assume that Seattle and Los Angeles are comparable in response to temperature and air quality and are, at the very least, unclear about how they arrive at their calculations.
University of Oregon study does not match real world data from Seattle
If those problems weren’t troubling enough, we now have empirical data with which to test their hypotheses. The real world results simply do not match the claims made by the authors of the University of Oregon study.
For example, as noted above, the University of Oregon study uses the 2007 IPCC climate projections and the most extreme temperature scenario in that report. Using newer and more accurate data, however, produces very different results. The data from the 2013 IPCC scenario known as RCP 4.5 are not only more recent, but they reflect recent experience more accurately. As the graph from the IPCC demonstrates, temperature change since 2005 is at the low end of this scenario. Thus, even the RCP 4.5 scenario may exaggerate real-world impacts.
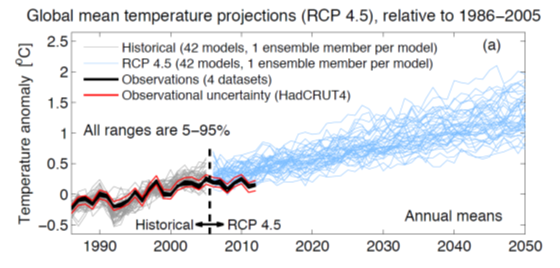
Instead of the four degrees Celsius increase by year 2100 projected by the A1FI scenario, as used by the University of Oregon, the RCP 4.5 scenario projects to a temperature increase of 2.6 degrees Celsius.
Further, real-world data do not match the projections made in the study cited by the University of Oregon authors. Comparing the summer of 2012, a year with temperatures below average in June and July and above average in August, to the summer of 2014, with temperatures comparable to what we would expect to see in 2050 or beyond, the differences in ozone levels do not match the projections.
July 2014 was an average of 2.7 degrees Celsius warmer than July 2012. This is roughly equivalent to the 2100 global projection under RCP 4.5, but less than the 2100 land temperature projection. Ozone levels increased about 6 percent. The temperature increase for August between the two years was just less than one degree Celsius, but ozone levels declined dramatically by nearly 30 percent. That decline occurred despite the fact that August 2014 was 1.6 degrees Celsius greater than the “normal” temperature for that time of year.
It is also important to note that in July 2014, the month most comparable to long-term projections of temperature increases for Seattle, the maximum eight-hour ozone levels never exceeded 46 parts per billion (ppb), still 35 percent below the very conservative level called “protective of human health” by the Puget Sound Clean Air Agency. Even with an average increase of 6 percent, as claimed in the study, ozone levels would not approach levels called unhealthful to humans in any eight-hour time period.
To back up their claim that their cited numbers are reasonable, the University of Oregon authors cite a study from the University of Washington that they argue has forecasts for ozone increase that are “far higher.” That the University of Washington study projects maximum eight-hour ozone levels for in the mid-century at an average 26.5 ppb. At that level, the University of Washington study claims human mortality from ozone would increase by 26 percent.
In fact, during the summers of 2012 and 2014, we saw even higher eight-hour ozone levels, averaging 27.3 ppb. As a result, we should have seen a 26 percent increase in ozone-related cardiopulmonary deaths or asthma-related hospitalizations. Public health data for 2014 are not yet available, but 2012 data shows a dramatic decrease in ozone-related health threats compared with recent years – the opposite of what is predicted by the University of Oregon study.
In 2012, the rate of asthma hospitalizations in King County was 41.81 per 100,000 population. This is 12 percent less than in 2010, and 20 percent less than the average for the years 2006 to 2010. Far from causing a spike in asthma hospitalizations, the trend continued dramatically downward. This is not to say that increased ozone reduces hospitalizations. What it does indicate, however, is that air quality in Washington state is well within the “healthy” range for humans, and that projected ozone changes do not impact that status, and are in fact insignificant compared to other factors, like indoor air quality, that affect asthma sufferers.
A 90 percent reduction in impacts from premature deaths
Finally, correcting just two of the flaws in the study demonstrates how inaccurate the report is.
First, instead of using the extreme and outdated temperature projections of the 2007 A1FI scenario, we can more reasonably use the more accurate and updated 2013 RCP 4.5 scenario. This cuts the estimated temperature projection by one-third.
Second, we can apply the actual range suggested in the ozone study of nonaccidental mortality of 0.11 – 0.27 percent by 2050, instead of cherry-picking the highest end of that range.
By simply adjusting for the full range and using temperature projections from RCP 4.5, the projected cost impact falls by more than 90 percent. Those two adjustments for accuracy reduce projected impacts by about $350 million in 2020.
To put this in context, the authors originally claimed that Washington state would see an additional 56 deaths in 2020. This estimate declines to an additional five deaths just by applying the two adjustments described above. This would amount to an increase of 1/100th of 1 percent in mortality in Washington state. Such phony statistical precision is not defensible. The additional fact that ozone-related mortality rates are declining significantly demonstrates how dubious the University of Oregon study’s claims are.
Accurate adjustments for increased morbidity and lost productivity are impossible because the Next 10 study cited by the University of Oregon does not match the authors’ claims and provides no explanation for how they arrived at their conclusions. At the very least, these two projections rely on the extreme, outdated A1FI scenario that is 35 percent higher than current projections.
Further, as noted above, real-world, King County data on asthma-related hospitalizations demonstrate that time lost at work and school is actually declining even in relatively high-ozone years. This makes any claim of reduced productivity due to air quality changes contrary to reality.
Conclusion
Much of the discussion about climate policy in Washington state involves raising the specter of catastrophic economic impacts as a way of justifying expensive and harmful policies. This Executive Order makes use of this approach, warning that unless we take action, the costs to Washington’s economy will be significant. As a result, the argument goes, even expensive policies are less expensive than doing nothing. A close look at the research, though, shows this is not true.
The University of Oregon study’s flaws are so numerous it is not useful as a guidepost for policymaking. The study’s authors mischaracterize the research they cite, they use outdated and exaggerated temperature projections and they use unsourced claims that contradict real-world experience.
Often, those who support action to reduce carbon emissions lament the fact that the public is not more supportive of their policies. After more than a decade of exaggerated and false claims, however, the public and some policymakers have understandably grown skeptical of each new exaggeration. The University of Oregon study is just the latest in that long trend.
Science-based and effective climate policy cannot be built on exaggeration and fear. Sound public policy must be justifiable whether the effects of climate change are significant or tiny. A policy that cuts regulation, puts a price on carbon and cuts taxes would reduce barriers to job growth, give taxpayers more control over what they pay and reduce the flow of money to Iran and Vladimir Putin’s Russia. All sides should agree those are worthy policy goals. Such an approach would also cut carbon emissions and reduce the risk of climate change no matter how significant or how small.
As long as our approach to climate policy is sensational and exaggerated, however, a solution will continue to elude us.